Introduction
In summer 2018, I travelled across the country to Berthoud, Colorado to join Ursa Major Technologies as an intern. Ursa Major is a rocket propulsion startup founded by former employees of space technology giants like SpaceX and Blue Origin. Having mainly been exposed to in-atmosphere aerospace engineering concepts while an intern at NAVAIR, this internship offered me a great chance to get a taste of how engineering works for space technologies.
Projects
Valve Test Automation
Introduction
All valves used in Ursa Major’s engines are required to be tested for flow quality before they can be implemented. Valves are tested for flow quality by running water through them several times, calculating the flow coefficient for each iteration, and making sure that the flow coefficient generally matches the factory-labelled flow coefficient (usually compared with the average flow coefficient over the set of iterations). This test must occur for a wide range of position fractions (pos. frac.); the position fraction is a measure of how “open” the valve is and is measured on a scale from 0 to 1. For example, a pos. frac. of 1 corresponds to “fully open,” whereas a pos. frac. of 0.5 means that the valve is only half open.
Flow coefficient, usually represented as $C_v$, is a measure of a valve’s capacity for flow; it’s a measure of how many US gallons of water at $60 \, {^{\circ}}{\mathrm{F}}$ may flow through the valve per minute when the pressure drop across the valve is $1 \, \mathrm{psi}$. Flow coefficient is calculated through the following equation1:
$$ C_v = Q{\frac{SG}{\sqrt{{\Delta}P}}} \stackrel{{H_2}O}{=} {\frac{Q}{\sqrt{{\Delta}P}}} $$
where
$$ \begin{cases} C_v & \text{Flow coefficient} \, [\frac{\frac{gal}{min}}{psi}], \\\ Q & \text{Flow rate} \, [\frac{gal}{min}], \\\ SG & \text{Specific gravity} \, [\text{unitless}] \, (1 \, \text{for} \, {H_2}O), \\\ {\Delta}P & \text{Pressure drop across the valve} \, [psi]. \end{cases} $$
Unfortunately, flow testing is a huge time and effort sink for the team, since it requires at least one person to complete the following tasks:
- Use a manometer to measure ${\Delta}P$ (to several significant digits) across the valve by pumping N2 through the valve
- Connect a water hose to the valve
- Measure the average value of $Q$ ($\bar{Q}_i$) for a given position fraction $i$:
- For each iteration $j$:
- Pumping water through the valve for a period of time (usually a minute or two)
- Collecting the water in a bucket
- Weighing the water in the bucket
- Dividing the weight (volume) of water collected by the duration of flow to calculate $Q_{i,j}$
- Repeating this process for several iterations
- Calculate $\bar{Q}_i$ by averaging $Q_{i,j}$ over $j$
- Repeat for each position fraction
- For each iteration $j$:
Solution Design
The Ursa team tasked me with designing a new automated system for flow testing. Such a system would have a number of benefits, including automatic data collection, less human error in the timing and weighing, quicker tests, and much less water usage.
The main design criteria that were to be met were as follows:
- General
- Be compatible with a spare rocket engine controller
- Fit on a medium-sized table/cart
- Record data in CSV format
- Capable of measuring over the following ranges:
- ${\Delta}P$: $50 \, \mathrm{psi}$ to $80 \, \mathrm{psi}$
- $C_v$: $0.02$ to $0.20$
- $Q$: $0.1 \, \frac{gal}{min}$ to $2 \, \frac{gal}{min}$
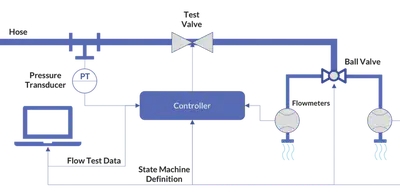
To mitigate the long duration of the tests, I chose to use an electronic flowmeter to measure the flow rate of the valve. This eliminated the need to use a bucket to manually obtain the volume of water that flowed through the valve. In my design, the flowmeter would average the flow rate over a short period of time and write this data to the CSV file that summarized the test results. In addition, I chose to use a pressure transducer to measure the pressure drop across the valve, thereby eliminating the need for nitrogen pumping.
An image of my design may be seen below.
Measurement Procedure
- For each position fraction $i$:
- Actuate valve to pos. frac. $i$
- For each test $j$ lasting for set time (nominally 30-60 seconds)
- Record measured pressure (psi) from pressure transducer output over set time interval
- Record $Q$ from flowmeter output over set time interval
- Using controller data after all test over all values of $i$ finished:
- Calculate ${C_v}_{i,j}$ for each individual test $j$
- Calculate ${{\bar{C}_v}}_{i}$ for each pos. frac. $i$ by taking average of ${C_v}_{i,j}$ over $j$
- Generate plot of ${{\bar{C}_v}}_i$ vs. $i$ and verify that curve is not abnormal
Equipment
The flowmeter I chose for the design was the Omega MMA100V5P4C1T3A5, and the pressure transducer I chose was the Omega FLR6302D. These decisions were primarily motivated by the constraints on compatibility with the controller and measurement ranges.
Other
To understand the flow test process so that I could work on its automation, I regularly performed flow tests on the various valves used in the engines. In addition, I performed other
Wrike API Automation
In addition, I wrote a program to automate the posting of empty template test summaries to Wrike, a project management application. This program uses Python’s requests library to send HTTP POST and GET requests to Wrike’s API. This proved useful for the team because it saved them the trouble of creating new summaries through manually copying and pasting older summaries; my script made it simple to create a new summary with a blank template that they could then fill in afterwards.
Takeaways
- Introduction to:
- Rocket engine design
- Control system design
- HTTP requests
- JSON
Conclusion
On the whole, I thoroughly enjoyed my time at Ursa Major. Having previously interned at large organizations (one private, one governmental), I was eager to learn about the logistics of a smaller startup. I definitely noticed some differences, and I feel that I now have an enhanced perspective on how company operations vary with size.
Another difference was in the type of work done. Most of my previous internship work was done sitting at a desk for most of the day; at Ursa Major, that type of work definitely existed, but was complemented by lots of hands-on work. Work such as manually testing valve flow rates from 6 am in the morning to the late afternoon wasn’t necessarily “fun” — but since I had little prior in situ experience, learning how to use a variety of tools and equipment in the Ursa “high bay” was definitely enriching. In addition, watching the engine tests happen live (from a safe distance, of course) was probably the coolest thing I’ve gotten to do at any of my internships!